experience
Life is complex.
Data problems can look impossible to resolve.
But solutions can be simpler than you think.
And no, you probably don't need AI
EMPOWER ME!My vision is to help create a world where everyone can use technology and human-centered design to accomplish their mission more efficiently. I accomplish this by developing corporate strategy, eliminating roadblocks, and empowering staff to be successful and independent.
People don't make mistakes. Problems are most often attributable to unrealistic processes and governance structures.
Generating accurate user requirements is much trickier than people think. Quick iteration helps debug this process.
The correct technology and strategy makes it easy for people to eventually do the right thing and difficult to do the wrong thing.
I strongly believe in the value of diverse teams. I also believe in treating people equally regardless of their personal descriptors.
When building/upgrading solutions, it can be tempting to try to build "the perfect system". Resist the urge and build the minimum viable product.
No technical solution will be successful without 3 things: training, proper governance, and management support. Consider the humans!
The following metrics should provide a view of my technical capabilities
Working with top management to demystify technology
Helping beginner, intermediate, and advanced analysts become problem-solving ninjas
When you know what you need, you just need a hand
The panel discussed the role of technology within the legal sector, and the resulting effect on access to justice.
My high-level position is that we need investment in #lawtech, and regulation in #AI in general... innovation will come. We also discussed the dangers of how we risk perpetuating injustices in this new AI world, and continuing (or exacerbating) the problems that lead to marginalised communities not having access to justice. Considering the huge unmet need, for example, within social care, technology HAS TO be a major part of the solution, but if leading tech is built by techbros with no lived experience, we risk missing the mark. We need real #diversity in the design team, in the C-suite, and in the donor organisations in order to make a lasting change.
BACKData is wonderful and very powerful, however, converting data into action is very difficult. In this provocative talk, we explore some of the pushback that limits this transformation.
BACKKnowledge Graphs provide a graphical simplification of a specific topic. Not only that, they allow us to use network analysis to transverse a topic, and in so doing, new insight becomes ripe for the picking.
The problem I was trying to solve though, was that I wanted to create a knowledge graph out of any corpus. That would allow me to feed in a pdf, and have a knowledge graph pop out. In this talk, I describe my attempts to make this a reality.
BACKThis project was a collaboration with the Superintendency of the Environment (SMA) in Chile. SMA must respond to all citizen complaints, but needed a better way to prioritize where to allocate its efforts.
The project used a mix of structured (e.g., facility information) and unstructured (e.g., description of environmental problems) data to prioritise complaints by identifying those that are more likely to lead to grave sanctions as well as those that are outside of the SMA remit. The two models we developed, now in production, help SMA be more expedient, and more effective.
- - BACKThis talk, presented virtually for EARL 2021, goes over the significant importance of network analysis, and goes over basic principles and how to accomplish these using R. -
BACKAs I was beginning to fall in love w/ NLP, I was also falling in love with a beautiful woman, now my wife. For our one year aniverary I created a dashboard displaying several metrics of our relationship as analyzed by our text messages. Note: this is a stupid idea. Note2: but she married me anyway, so...
BACKI have written several entries in my blog providing detailed instructions allowing users to replicate functionality. Particularly my old Excel tutorials were well received, and the questions/feedback helped guide my subsequent content.
BACKI have created several youtube tutorials guiding people through tools I have created, or through the analytical process. Please check the two links below, the first goes to my Excel tutorials, the second to Power BI / R tutorials (I lost all the views and comments when I moved the R videos to this new channel, please share widely!).
BACKWhen songs go from one chord to another (chord progressions), people feel certain things. We like to think that our relationship with music is unique and special, but it turns out that there are highly generalizable rules developed by society that inform how music should make us feel. These feelings are highly cultural, with the "auditory tropes" being different in western rock and middle eastern classical music for example. I connected to the API of Hooktheory in order to visualize common progressions.
BACKShiny is awesome but a bit daunting and easy to make mistakes in. I built this package as more or less a "Shiny linter" that protects against the most common errors, and also provides a nice network chart showing dependencies. Useful when working with reactives which may have the correct inputs, or not. :) This package is on CRAN as "ShinyTester".
BACKThis package was developed to allow users to single out one number in their reports. Now there are built in options to accomplish the same functionality in several more popular pacakges, although this package still has some relevance in terms of creating highly customized visuals. Take it for a spin! This package is not on CRAN, but you can get it from my github.
BACKOne of the problems of "having too much stuff" is that it becomes difficult to keep track of it, and to know where gaps exist. This was the case with the AQUASTAT assets. We had the main database, yes, but we also had maps, profiles, tables, info sheets, etc. In an attempt to quantify and make available these resources, I created a Shiny app that displayed them all (and identified broken links). The app is not live anymore, but you can see the motivation document by clicking the "more" button below.
BACKIt can take **years** to gather high quality data on global irrigation. And when you have the data and include it into your reports, everyone rejoices... for a while. And after a year or two, everybody forgets and complains about how old the data is. Well, I discovered that by creating attractive and novel visualizations, we could a) bring a new perspective to the experts, b) introduce the material to a new batch of scientists, and c) create new outputs extremely cost-effectively. Thus were born the irrigation treemaps. Unfortunately they are no longer online.
BACKIn order to calculate the flow of water from country to country, we kept detailed information about river flows. It ocurred to me that there's a "from", there's a "to"... that's network information! I created force network charts which were interesting, but value really came out of the sankey chart representation. The countries self-organized from upstream to downstream countries. We immediately tried to develop a relationship with the legal department to do an analysis of global water policies based on upstream/downstream-ness, but "it didn't work out" :). Still, the visuals themselves were powerful and created quite a stir by demonstrating the scale of relative flows. Also, they are just pretty.
BACKThe ggplot2movies R package has a list of old movies. I was curious about the old "animation" movies, and once I extracted these, I wrote a function to query Bing w/ each animation and capture the resulting youtube link. From there, I did some probabilistic string matching magic to determine if I had indeed found the youtube of each animation and then created a list of all these.
BACKThe last task I performed for AQUASTAT was to try to find the best way to estimate the anthropogenic evaporation from dams. In order to accomplish this, I had to scrape information from Wikipedia/Wikimedia (ask me how I did this and prepare for hilarity), and OpenStreetMap. The analysis could have gone further as it was prepared while I was preparing my handover notes, but it still yielded the most highest quality repository of global dam information available at the time. -
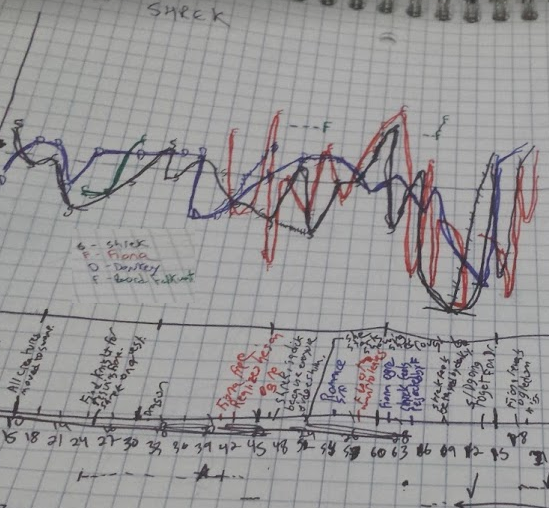
BACKI was watching Shrek when my awareness was focused on the emotional valence of the gender-roles the characters were forced to carry out. After a bit of research, I decided to analyze the emotional valence of different "chick flicks" vs "action movies" (I do not endorse these terms nor their equivalence with gender roles) to see if we could extract semantic differences in how the scripts were constructed.
BACKI'll be the first to say that it takes training and time for people of all levels to understand this visual, but once "over the hump" it's really cool! It provides a concise tool for managers to make effective interventions from week to week, and for employees to know what they have to work on, and it provides an elegant method of bypassing the (long, expensive, potentially inacurate) forecasting step. We liked it so much, we created a package available for anybody to use here. This package is not on CRAN.
BACKThis presentation shows some of the differences between Unit Tests, Integration Tests, and introduces a fun little surprise at the end!
Presented at LondonR 2020. -
BACKThis talk documents optimizations to the reconciliation efforts in post-conflict Colombia.
Presented at EARL London 2019
-
BACK
Presentation to other data scientists in charities and NGOs. Also discussed the ACDI/VOCA toolset
Presented at Social Data Society - 2018
BACKDiscussion and training on how data is managed at ACDI/VOCA
Presented at Data4Good 2018 BACK
Discussing how culture change was brought about within ACDI/VOCA
Presented at Humentum Annual Conference 2018 BACK
Data is so much more than just numbers for an auditor. In this presentation, we discussed how the LEAP system allowed the company to come to life, and leverage numbers into data, data into knowledge, and knowledge into results.
Presented at MERL Tech London 2018 BACK
The event focused on how to use our project monitoring system to measure impact.
Presented at MERL (Monitoring, Evaluation, Reporting and Learning) COP Learning Event 2017- Tanzania
Presented at Ethiopia Theory of Change Evaluation TOPS 2017
So much international development data is not comparable, frought with errors, and incomplete, that it can be frustrating to try to interpret the information to infer something about the world. In this presentation, I explain the efforts of the AQUASTAT team to minimize the frustration and to put forward the best information possible.
Presented at EARL London 2017 - BACK
The DBBUDDY tool allows synchronization of robust offline data gathering tech (ODK) with cloud databases in a completely ad hoc way. This allows users maximum flexibility to gather offline data for any database table, with full assurance that the data will be compliant and correct!
Presented at Society for International Development (SID) 2019
-
Innovation competition finalist
BACK
Amit is an RPI alumnus, and environmental engineer turned data director. He started his career collecting and using environmental data to clean soil and water, then disseminated water data with UN-FAO’s AQUASTAT. Recently he stepped down from his role as Data Director at ACDI/VOCA in order to pursue wider consulting and volunteering interests.
Amit’s deep commitment to empowering underprivileged communities comes from his experience growing up in 'developing countries' and witnessing every extreme in living conditions. As a person of Mexican and Indian heritage, Amit values diversity and is a proud advocate of women and minorities in the workplace.
Deep discounts are available for charities, NGOs, UN organizations, or anyone working towards empowering the disenfranchised (including some pro bono work).
Feel free to email me: data@amitkohli.com, or to schedule an appointment to discuss your use case:
Let's talk :)Hey, I get it... Sometimes you just need a quick push, or a fresh set of eyes to look at some code. I have set up a quick appointment request where you can schedule 30 minutes of my time for £50.
Easy. Quick. Done.
30 minute consultation ASAP! (£50)Copyright © 2021 Amit Kohli. Thanks to Inovatik for website template.